Dynamic Syndications select our yearling purchases
equally upon aspects of
pedigree genetics as we do on:
conformation, size, scope and clean veterinary reports which must include
x‐rays, endoscopic evaluation and blood testing.
However, we have been following a business philosophy for a long period of time, where
we divide pedigrees into 5 categories, A, B, C, D, F each with several subsets.
We engage the philosophy that
we only purchase horses that rate within the Top Group of pedigree rating scores.
We will
only inspect yearlings at the sales that rated within a genetic band between
B+ up to
A+++.
Because pedigree ratings are constantly changing, a
B+ score today could become an
A in a few weeks’ time, so we also do include
B+ ratings scores in our inspection lists.
However, if a horse rates
B or below, we
don’t inspect them at the sales.
Owners often ask us
"how does our philosophy translate into actual results across all racing jurisdictions?"
At the end of September 2020, we did an
updated review and analysis of the
BEST RACEHORSES on the
Longines World Rankings for the past
7 seasons.
There were in total
70 Positions available to be rated over this period. However,
13 positions were taken by the same horse from the year before, so they have only been counted once.
Therefore, these Pedigree Rating Scores revealed
57 Individual Horses in these lists:
49 of 57 scored a rating of B+ or above = that’s 86% of the World’s Best Racehorses
28 of 57 (49%) rated to the ultimate A+++ score;
3 x A++ (5%);
7 x A+ (12%);
9 x A (16%);
2 x B+ (4%).
There were
8 horses (
14%) that made it onto the World’s Best Racehorses List over the 7 seasons who had an
average or below average pedigree rating range.
There were:
2 x “B” rating scores,
2 x “C+” rating scores,
1 x “C” rating score,
1 x “D+” rating score and
2 x “F” rating scores.
This will always occur because of natural variations however data proves that between
20 - 25% (varies year on year) of the foal crop produced each season,
86% of the Best Racehorses are sourced from this subset.
Therefore it’s a simple and very successful game plan – we only inspect the
20-25% of the horses that rate between
B+ to A+++ because it produces
86% of the
Best Racehorses and we leave the other
75-80% of the total foal crop to the unaware buyer for them to compete for of those elusive
14% of Top Racehorses.
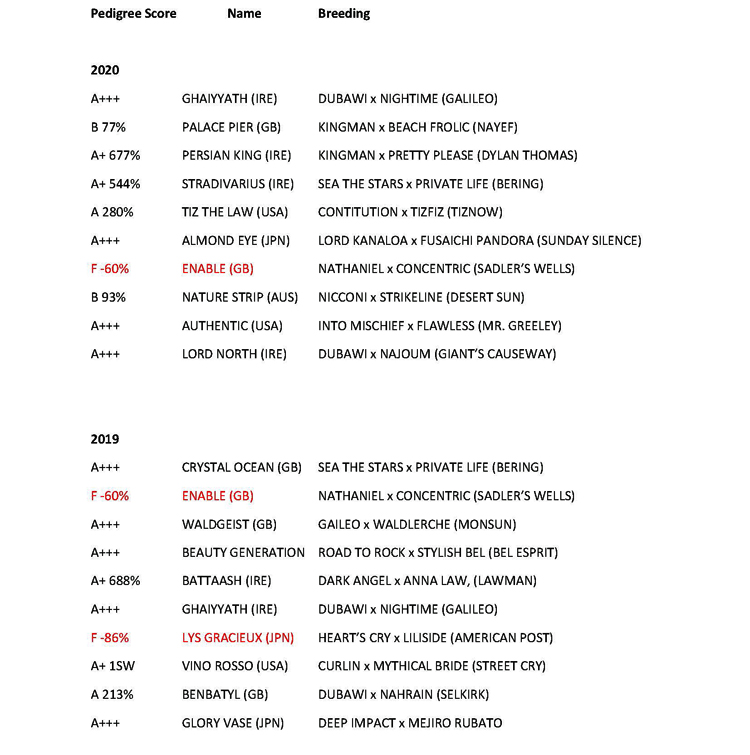
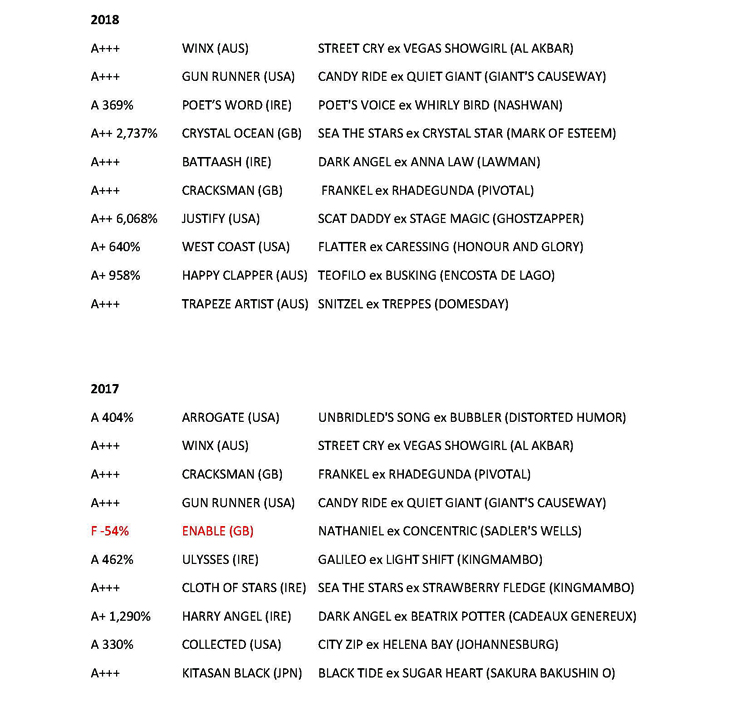
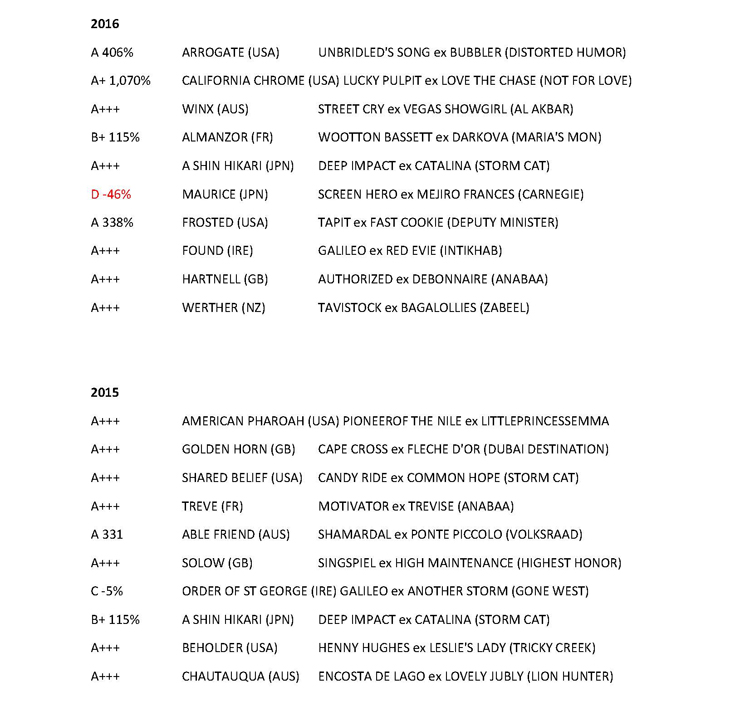
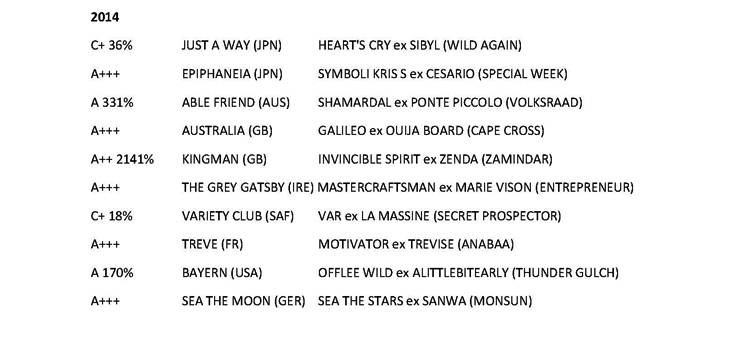
 The World's TOP 10 Racehorses for the past 7 seasons are listed below.
 So, how do these finding compare to the thoroughbred industry in Australia?
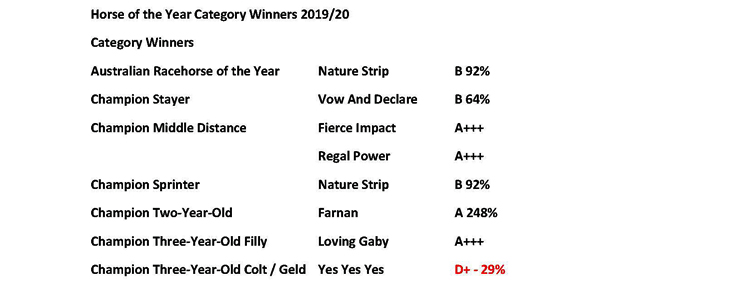
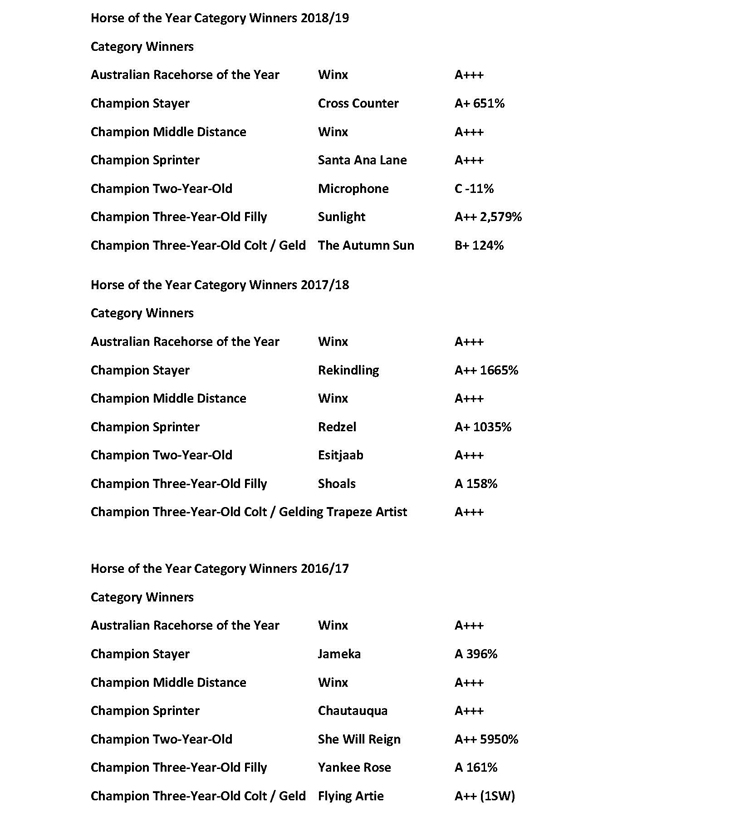
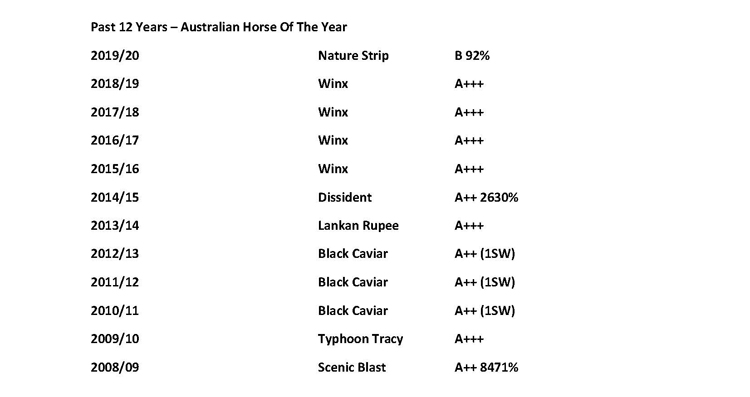
Australian Summary:
It’s no coincidence that the trend in Australia follows that same trend set worldwide – because we are talking about
genetics over commerciality and environmental factors.
The results can’t be denied - the Best Racehorses were Bred to be the Best.
Continuing with the observations that
B+ and above rated matings produce
86% of Top Class, Stakes-Winning racehorses,
Dynamic Syndications spends countless hours researching and analysing the breeding pattern of every yearling catalogued for every sale, identifying those horses that meet the minimum standard of B+ and above.
We reject all other yearlings that rate B or below and we concentrate our physical inspections amongst only qualified lots.
 It’s not rocket science – it’s due diligence and attention to detail.
Our most recent
Black-Type winner LOVE TAP who won the
Gr3 Gloaming Stakes over 1800m at his most recent start is an example of genetic knowledge being important.
An
$110,000 purchase at the Magic Millions Sales, when we selected him, he had a rating score of
A+++ and the cross of
TAPIT over FORESTRY Mares had
8 foals to race: 7 Winners & 1 placed including 2 Stakes Winners.
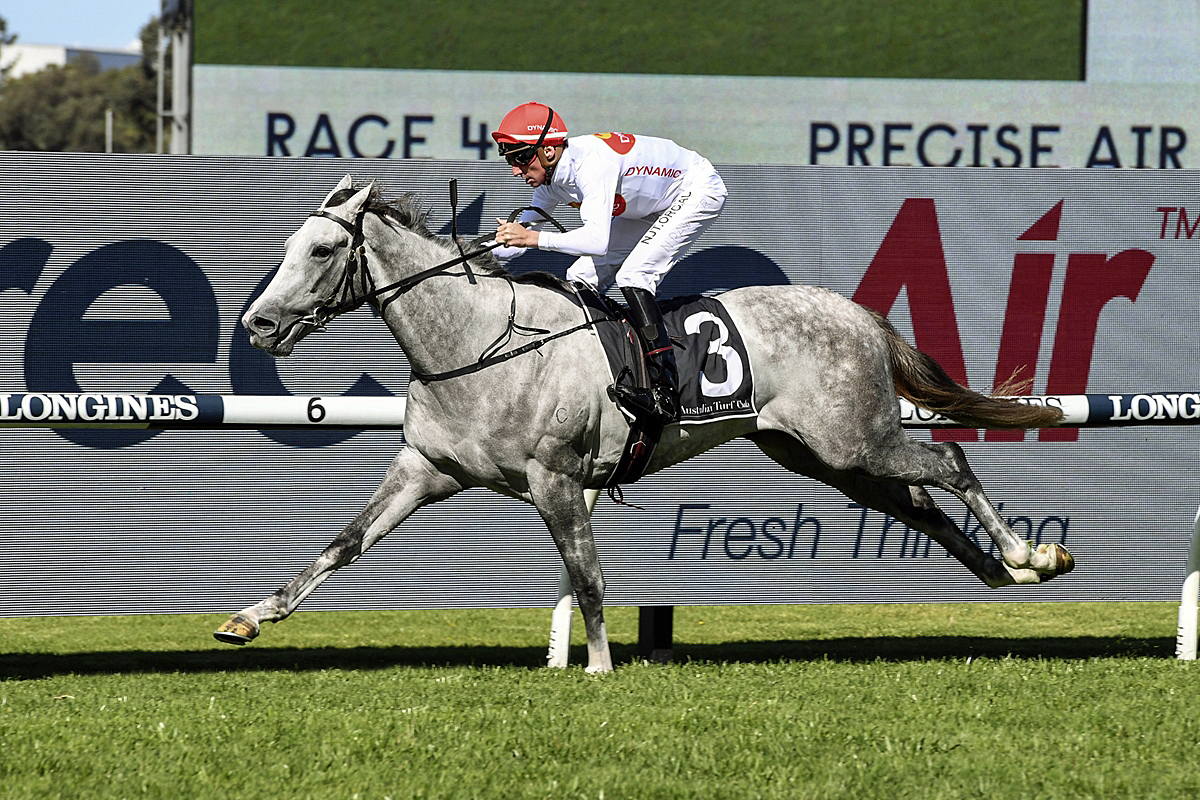
Add in excellent conformation, size and scope, to match his athletic frame and a clean veterinary report he was a target for us to purchase.
That’s why at
Dynamic Syndications our
Winners : Runners ratio is so high with
236 Individual Winners /
261 Individual Runners =
90.4% (as at 30 September 2020).
Proudly, we lead the industry for actual racetrack success!